

The Viral Statistic Almost Nobody Explains Correctly | By Adrian Cole | aireviewcore.com
If you have spent any time researching enterprise AI this year, you have seen the number: AI agents fail somewhere between 70% and 95% of the time. It shows up in LinkedIn posts, vendor blog posts, and conference keynotes, repeated with the confidence of settled fact. What almost nobody explains is what the number actually measures, where it originates, or whether it applies to the specific agent you are about to deploy.
This guide breaks down the real AI agent failure rate — where the figure comes from, why it varies so dramatically depending on how “failure” gets defined, and what actually causes agents to break once they leave a demo environment and enter production.
Table of Contents
What the AI Agent Failure Rate Actually Measures
The AI agent failure rate refers to how often an autonomous or semi-autonomous AI system fails to complete a task correctly without human intervention. It sounds like a single, clean metric. In practice, it is several different metrics wearing the same name.
Depending on the source, “failure” can mean any of the following: the agent did not complete the assigned task at all, the agent completed the task but produced an incorrect or unusable result, the agent completed the task in a sandbox benchmark but was never deployed to production, or the overall project was cancelled before reaching production regardless of how the underlying model performed.
That distinction matters enormously, because the widely cited 70–95% figure traces back specifically to production deployment data — not benchmark scores, and not project cancellation rates. Conflating the three is where most coverage of this topic goes wrong, and it is exactly the confusion this guide exists to untangle.
Where the 70–95% Figure Actually Comes From
The number originates primarily from Fiddler AI, an AI observability company that tracks production agent deployments across enterprise customers. Fiddler frames the range specifically as a production failure rate — the share of agents that fail to complete complex, multi-step tasks correctly in real-world deployments without human correction.
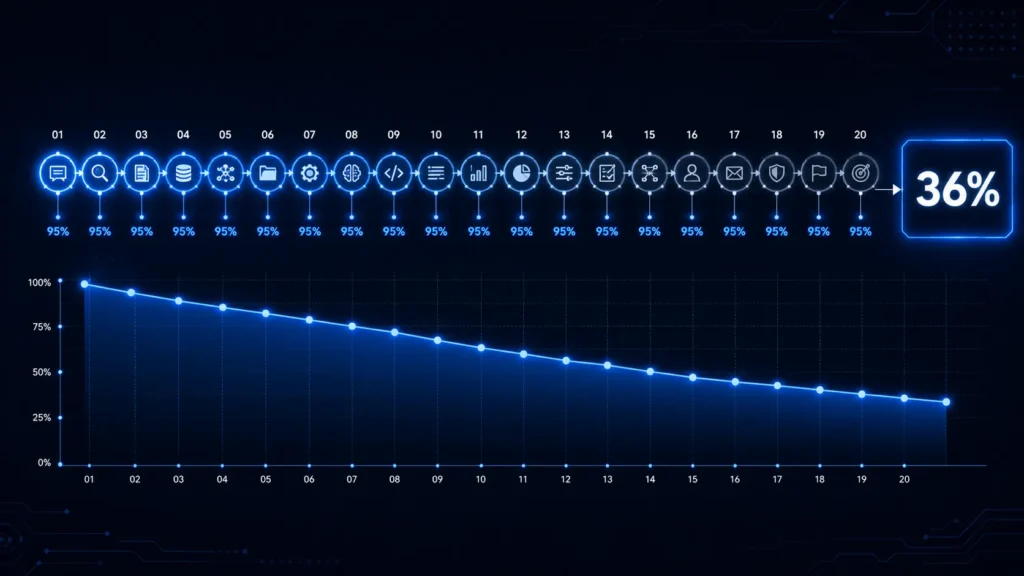
The mechanism behind the number is not mysterious. It is ordinary compounding arithmetic applied to a multi-step system. If a single agent succeeds at its task 95% of the time, a workflow of twenty sequential steps — where each step depends on the previous one’s output — succeeds only about 36% of the time overall, because the failure probability compounds at every handoff rather than averaging out. This is the single most important mechanical fact in this entire discussion: production failure rates run high not primarily because any individual step is unreliable, but because errors multiply across steps in a chain.
Independent measurement backs this up from a different angle. On the WebArena benchmark — a self-hosted, realistic web environment built to test autonomous agents on 812 tasks across real sites like shopping, forums, and content management — the strongest GPT-4-based agent tested achieved an end-to-end task success rate of only 14.41%, compared to human performance of 78.24% on the same tasks. And reliability does not just mean getting something right once — it means getting it right consistently. The tau-bench benchmark, which measures consistency using a metric called pass@k, found that an agent scoring around 60% on a single attempt (pass@1) dropped to roughly 25% when required to get the same task right across eight consecutive attempts (pass@8). Because failures on repeated runs are not independent of each other, some tasks an agent handles reliably almost every time, and others it fails on almost every time — a pattern that single-run testing simply cannot detect.
The Carnegie Mellon Benchmark Everyone Misquotes
Part of the reason the 70% figure spread so widely is that it echoes a separate, frequently misquoted academic study — and the way that study gets summarized in headlines is where a lot of the confusion compounds.
Researchers at Carnegie Mellon University, working with Duke University and several independent collaborators, built a simulation environment called TheAgentCompany to benchmark how AI agents handle real office and software-engineering tasks: filing expense reports, writing code, navigating internal company tools, coordinating with simulated colleagues over chat. The paper was first posted to arXiv in December 2024 and later updated, with the benchmark receiving wide press coverage through 2025. The environment replicates a small software company complete with a GitLab-style code repository, an ownCloud file server, a Plane project-management tool, a RocketChat messaging system, and 175 distinct tasks spanning software development, project management, data science, administrative work, HR, and finance.
The result that made headlines: in the original evaluation, the best-performing model — Anthropic’s Claude 3.5 Sonnet — autonomously completed only 24.0% of the 175 assigned tasks, rising to a 34.4% score when partial credit for incomplete-but-useful progress was included. Google’s Gemini 2.0 Flash and Amazon’s Nova Pro performed considerably worse in that same round, at 11.4% and 1.7% respectively. Coverage of the study rounded the roughly 76% incompletion rate for the top model into the now-familiar “agents fail at office tasks roughly 70% of the time” framing.
That framing is not entirely wrong, but it flattens an important nuance. The 24% figure is a full-completion rate on a fixed benchmark suite under controlled conditions — not a production failure rate, and not evidence that agents are “wrong” 70% of the time in every context. It also is not a static number. The authors later updated the same paper with a newer model evaluation: Google’s Gemini 2.5 Pro reached 30.3% full completion (39.3% with partial credit), overtaking Claude 3.5 Sonnet’s original score and becoming the top performer in the updated results table. That is genuine year-over-year progress on the identical benchmark — but still nowhere close to production-grade reliability on long-horizon office work, and still a very different measurement than Fiddler’s separately sourced production failure statistic. The paper’s own error analysis found that the most common failure modes were not coding mistakes but weak social and browsing skills — agents struggled to communicate naturally with simulated colleagues, sometimes couldn’t close a simple browser pop-up, and occasionally took self-defeating shortcuts, such as renaming a user instead of actually locating and messaging the correct person.
So the honest picture is two related but distinct statistics that converged into one viral talking point: Fiddler AI’s production failure rate of 70–95%, based on observed enterprise deployments, and CMU’s benchmark completion rate of roughly 24–34% (later 30–39% with newer models) task success on a controlled office-task simulation, popularly and imprecisely reported as a “70% failure rate.” Both point in the same direction — reliability remains a real, unsolved problem — but they are not interchangeable, and treating them as the same measurement misleads more than it informs.
Three Layers That Get Blurred Into One Headline
To use this statistic responsibly, it helps to separate three layers that coverage routinely lumps together.
Task-level failure is the narrowest measure: did the agent complete this one specific task correctly? CMU’s benchmark data lives entirely at this layer — a controlled test suite with a fixed, known-correct answer for every task.
Production failure is broader and compounds over time rather than measuring a single attempt. A workflow with twenty sequential steps, each individually succeeding 95% of the time, still only completes correctly about 36% of the time overall — not because any one step is unreliable, but because the failure probability compounds across every handoff in the chain. This compounding effect is the core mechanical reason production failure rates run so much higher than any individual task’s error rate would suggest.
Project cancellation is organizational rather than technical. Gartner’s widely cited prediction, published June 25, 2025, states that over 40% of agentic AI projects will be canceled by the end of 2027 — driven by escalating costs, unclear business value, and inadequate risk controls, not by the underlying model failing to perform. Gartner VP Analyst Anushree Verma stated plainly that most agentic AI projects today are early-stage experiments driven by hype, and that many organizations are misapplying agentic AI to problems that never needed an agentic solution in the first place. In a Gartner survey of 3,412 webinar attendees from January 2025, only 19% said they were investing heavily in agentic AI, 42% were investing cautiously, and 31% were still in a wait-and-see posture. Gartner’s own estimate is striking on this point: of the thousands of vendors marketing agentic AI products, the firm believes only around 130 offer genuine agentic capability rather than a rebranded chatbot, RPA tool, or basic AI assistant — a phenomenon Gartner calls “agent washing.”
| Layer | What It Measures | Primary Source | Typical Figure |
|---|---|---|---|
| Task-level | Single-task completion on a fixed benchmark | CMU TheAgentCompany | 24–34% (up to 39.3% with newer models) |
| Production | Real-world multi-step deployment reliability | Fiddler AI | 70–95% failure |
| Cancellation | Organizational decision to abandon a project | Gartner | 40%+ by end of 2027 |
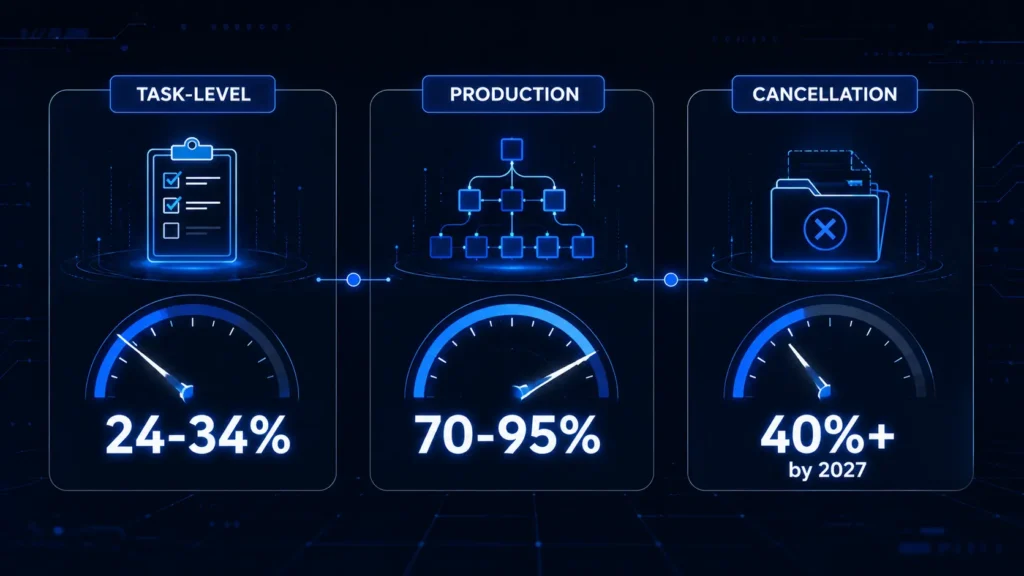
Grouping all three under one “AI agents fail X% of the time” headline is technically inaccurate. Understanding the distinction between them is exactly what you need to evaluate the actual risk of your own deployment, rather than reacting to a statistic that may not describe your situation at all.
The Five Root Causes Behind Production Failures
Once you look past the headline number, the actual failure modes reported across enterprise deployments and benchmark postmortems cluster into five recurring, well-documented patterns.
Context and memory breakdown. Long-running agent sessions lose track of earlier instructions as the context window fills with accumulated history — a pattern often described as “lost in the middle.” Working-memory degradation causes agents to forget operational constraints established earlier in a session, a problem that becomes especially pronounced past roughly 50,000 tokens of accumulated context.
Tool-calling and integration errors. Agents frequently misuse APIs, pass malformed parameters, or call the wrong tool entirely for a given task. Because agents act on live systems rather than simply generating text, a single bad tool call can cascade into a real-world consequence — a duplicated order, an incorrect refund, a misrouted invoice that someone has to manually reconcile after the fact.
Compounding errors across multi-step workflows. As the math above demonstrates, even a small per-step error rate becomes a large end-to-end failure rate once a task requires many sequential, dependent steps. This is the single most underappreciated cause of the gap between demo performance and production performance, and it is the same dynamic that produces the 60%-to-25% drop observed in tau-bench’s repeated-run testing.
Stale or unsynced data. A recurring pattern across production postmortems is agents reasoning against data that looked current but was not — approving a refund against an account that had already closed hours earlier, or committing inventory that had already sold, because the underlying system synced on a batch schedule rather than in real time. The agent behaved correctly given the information it had. The information itself was wrong.
Weak governance and missing guardrails. Many agent deployments grant broad permissions without human-in-the-loop checkpoints for high-impact actions, and without clearly defined success metrics that would catch failures before they compound into something costly. Gartner explicitly ties a significant share of project cancellations to inadequate risk controls rather than to model quality — which reinforces that the fix, in most cases, is architectural and organizational rather than a matter of waiting for a better model.
How to Reduce Your AI Agent Failure Rate
The genuinely useful news buried in all of this is that most of these failure modes are addressable through process changes rather than through better models. Based on the patterns above, a practical deployment checklist looks like this.
- Scope tasks narrowly. Shorter, well-bounded workflows fail less often than long autonomous chains, simply because there are fewer sequential steps for errors to compound across. A ten-step agent workflow is a fundamentally different reliability proposition than a two-step one, even using the identical underlying model.
- Instrument every tool call, not just the final output. Most production failures live in the action trail — what the agent actually did — rather than in what it reported doing. Logging and monitoring the full sequence of tool calls is what lets a team catch a retry loop, a hallucinated function call, or a runaway cost before it causes serious downstream damage.
- Keep data fresh and reconciled before connecting an agent to any system of record. Confirm that the data an agent reads is genuinely current rather than synced overnight, particularly for financial, inventory, or account-status decisions where stale data produces confidently wrong actions rather than confidently wrong text.
- Add human checkpoints for high-stakes, hard-to-reverse actions. Reserve full autonomy for low-risk, easily reversible tasks, and require explicit approval for anything carrying real financial or customer impact. This single practice is the most consistently cited mitigation across every failure analysis referenced in this guide.
- Define success metrics before deployment, not after something has already gone wrong. Unclear business value is one of the top reasons Gartner’s research identifies for agentic AI project cancellation — not because the technology failed on a technical level, but because nobody had defined in advance what “working” was actually supposed to mean.
- Pilot small and expand deliberately, treating early deployments as measurement exercises rather than launches. If you cannot quantify your current failure rate on real tasks, you have no way to tell whether a subsequent fix actually improved anything or just moved the failure somewhere less visible. Where possible, test consistency across repeated runs of the same task, not just a single pass — that is where the real reliability gap tends to surface.
Frequently Asked Questions
Is the 70–95% AI agent failure rate accurate? The figure is accurate as a description of what it actually measures — production deployment failure rates observed by Fiddler AI across enterprise customers. It becomes misleading when applied as a universal statement about AI agent capability in general, since it does not describe controlled benchmark performance or the outcome of any specific well-scoped deployment.
Does this mean AI agents do not work? No. It means reliability compounds badly across multi-step, tool-using workflows specifically, and that narrow, well-governed deployments perform very differently than broad, loosely scoped ones. The organizations avoiding the high end of the failure range are treating agent deployment as an engineering and governance discipline rather than shipping a demo as-is.
Why do different sources cite different failure rate numbers? Because “failure” is defined differently across sources. Some measure full task completion with no human correction. Others award partial credit for incomplete-but-useful progress. Some measure single-attempt success, while others measure consistency across repeated runs of the same task — which produces a much lower number, since tau-bench found a 60% single-run success rate falling to around 25% when the same task was repeated eight times.
What is the difference between a production failure rate and a project cancellation rate? A production failure rate measures whether a deployed agent completes tasks correctly. A project cancellation rate, like Gartner’s 40% prediction through 2027, measures whether an organization decides to abandon an agentic AI initiative entirely — a decision driven primarily by cost, unclear ROI, and governance gaps rather than by the technical failure rate of the agent itself.
How can I estimate the failure rate for my own planned AI agent deployment? Start by counting the sequential steps in your intended workflow and estimating a realistic per-step success rate based on task complexity. Apply the compounding math — multiply the per-step success rate by itself once for each step — to get a rough end-to-end estimate. This exercise alone frequently reveals that a workflow needs to be broken into smaller, independently verified stages rather than deployed as one long autonomous chain.
Are newer AI models reducing the failure rate over time? Yes, incrementally. CMU’s TheAgentCompany benchmark score for the top-performing model rose from 24.0% full completion with Claude 3.5 Sonnet in the original evaluation to 30.3% with Google’s Gemini 2.5 Pro in a later evaluation round of the same paper — genuine progress, but still far short of the reliability needed for unsupervised production deployment on long-horizon, multi-step office tasks.
The Bottom Line
The AI agent failure rate you have likely seen quoted — 70% to 95% — is real, but it describes production deployments under real-world conditions, not a universal ceiling on what AI agents are capable of. A separate, frequently conflated academic benchmark from Carnegie Mellon found completion rates closer to 24–34% (30–39% with newer models) on a fixed set of controlled office tasks. And a third figure entirely, Gartner’s 40% project-cancellation prediction through 2027, describes organizational decision-making, not model performance.
The honest takeaway is not “AI agents do not work.” It is that reliability compounds badly across multi-step, tool-using workflows, and that the organizations avoiding failure are the ones treating deployment as an engineering and governance discipline — narrow scope, instrumented tool calls, fresh data, human checkpoints on high-stakes actions, and success metrics defined before launch rather than after something breaks.
For specific tools small businesses can deploy with a narrower, more manageable scope than the enterprise deployments described in this guide, see our guide on the 4 best AI agents for small business in 2026.
Adrian Cole is a technology reviewer at aireviewcore.com covering AI agents, enterprise AI deployment, and practical guides for businesses evaluating AI infrastructure.
© 2026 aireviewcore.com — All rights reserved.